



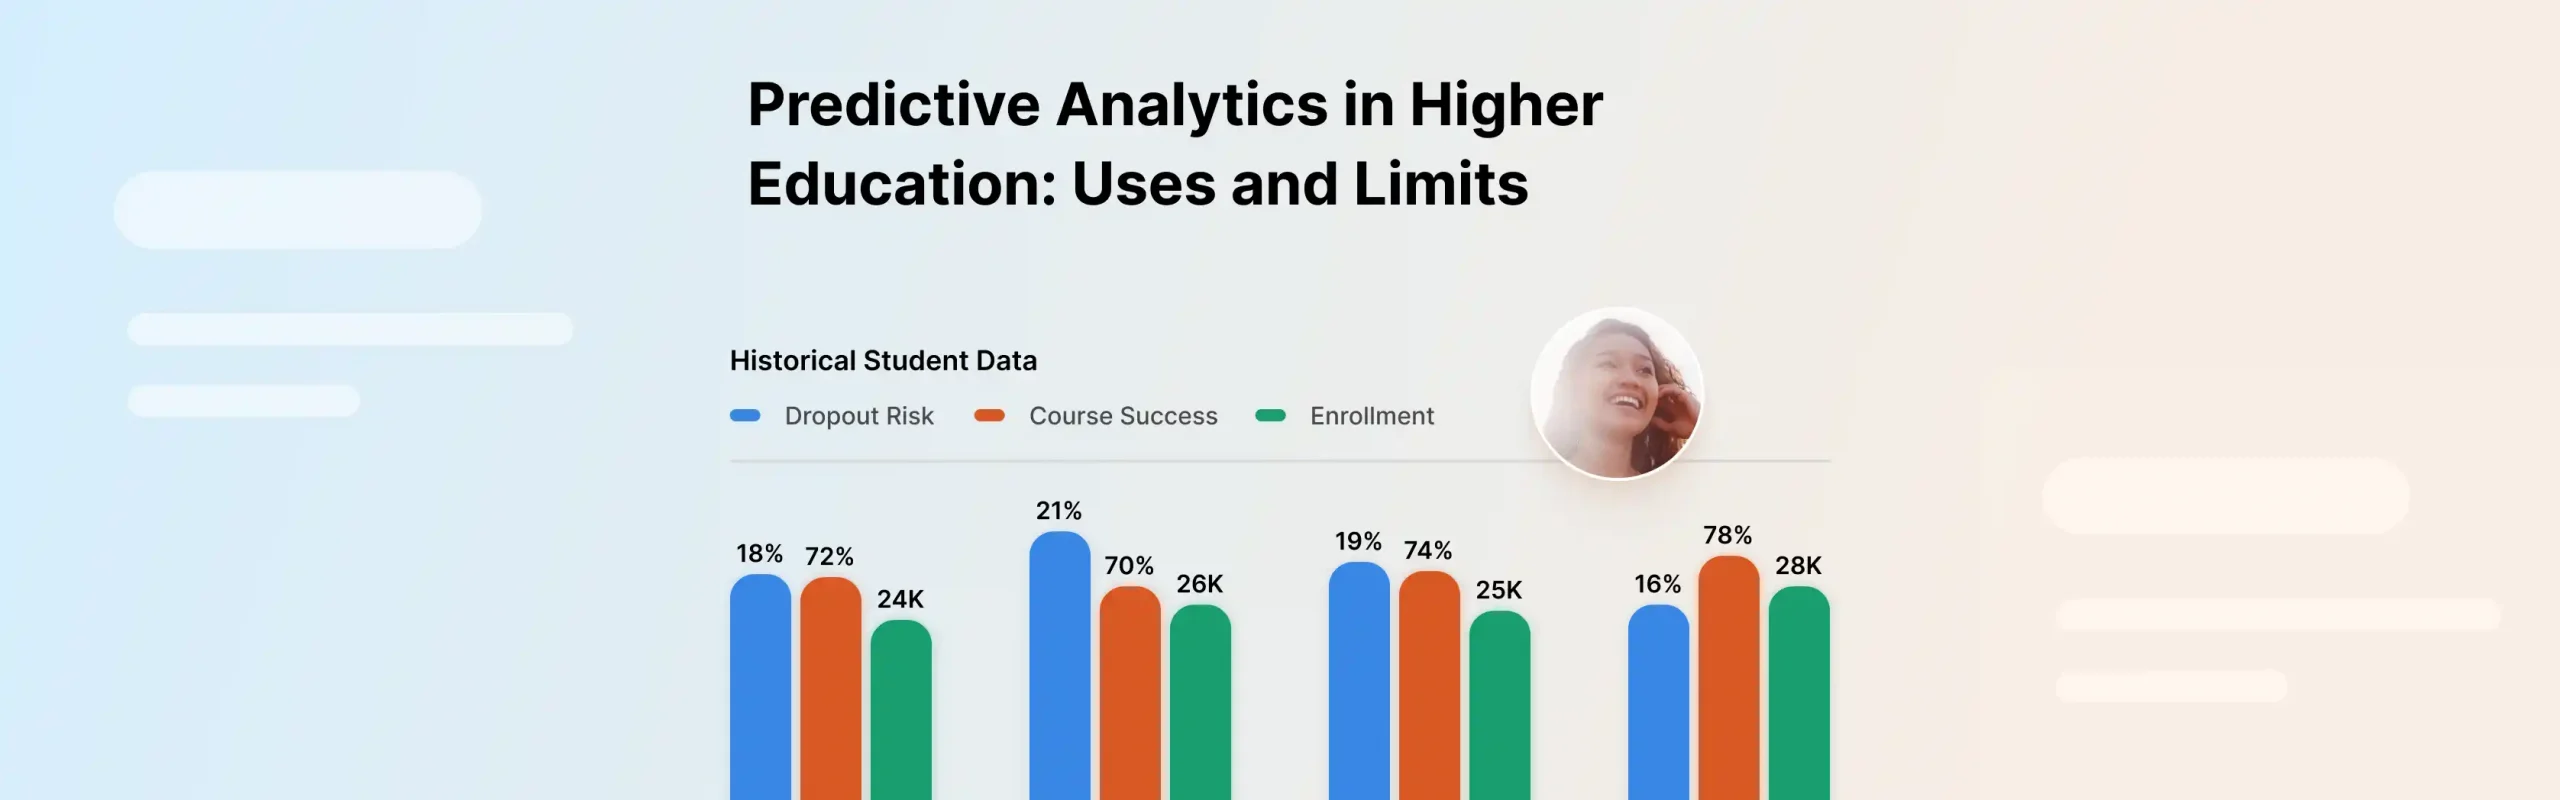
Predictive analytics in higher education uses historical student data, statistical models, and machine learning to forecast outcomes like dropout risk, course success, and enrollment likelihood before they happen. Instead of reacting after a student fails a class or stops enrolling, institutions can flag warning signs weeks or months earlier and intervene while there is still time to change the outcome.
This guide covers what predictive analytics actually does in a higher education setting, the specific use cases where it delivers value, real examples with real numbers, and the limitations that any institution considering this technology needs to plan around from day one.
What Is Predictive Analytics in Higher Education?
At a technical level, this means feeding institutional data grades, attendance, financial aid status, LMS activity, demographic information into a statistical or machine learning model trained to recognize patterns that preceded a specific outcome in the past.
The model then applies those patterns to current students to estimate how likely each one is to follow a similar path. It differs from descriptive analytics, which reports what already happened, and from simple dashboards, which summarize current status without forecasting forward.
A predictive model produces a probability: a student has, for example, a 70 percent likelihood of not returning next semester based on patterns found in thousands of similar students before them. That probability becomes useful the moment an advisor or system acts on it before the outcome occurs.
Most higher education predictive models draw on the same core data sources: the student information system, the learning management system, financial aid records, and admissions history.
Prediction quality depends entirely on the quality of that underlying data, which is why institutions with fragmented systems tend to see weaker results than those with a centralized student information system feeding clean, connected data into the model.
Know more about what a centralized student information system does →
How Student Data Analytics Powers Predictive Models in Higher Ed
Before any institution can forecast an outcome, it needs a reliable, unified record of what has already happened across every student touchpoint: grades, attendance, course registration, financial aid status, and engagement with course materials.
If grades live in one gradebook, attendance in a spreadsheet, and financial aid status in a third system, a predictive model either cannot access all three data types together or has to rely on stale, manually reconciled exports.
Our post on how to use data analytics to improve student performance covers the specific data points institutions should track before layering predictive models on top.
Platforms that unify student records, coursework, and attendance in one system solve this problem at the data layer rather than the modeling layer. Classe365, for instance, connects attendance data with LMS activity so that when a student’s attendance drops alongside falling grades, that correlation is visible in one dashboard rather than requiring someone to manually cross-reference two separate systems.
Benefits of Predictive Analytics for Colleges and Universities
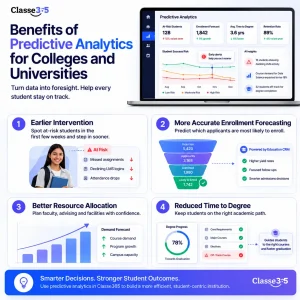
Earlier intervention. Predictive flags can surface risk indicators, missed assignments, declining LMS logins, and attendance drops in the first few weeks of a term.
More accurate enrollment forecasting. Admissions offices use predictive models, often layered on top of a CRM built for education, to estimate which applicants are most likely to accept an offer.
Better resource allocation. When leadership can forecast demand shifts, staffing and advising capacity can be planned ahead of time instead of reactively.
Reduced time to degree. Flagging students who register for courses that do not count toward their major helps them avoid costly detours. Our degree audit guide covers a related, non-predictive way institutions catch this through a degree audit module.
Predictive Analytics Use Cases in Higher Education
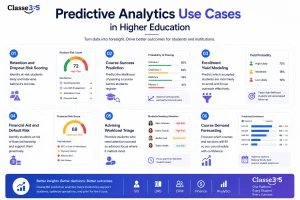
Predictive analytics shows up in a handful of specific, well-established use cases across higher education.
- Retention and dropout risk scoring: Risk scores based on academic performance, engagement, and financial indicators, updated throughout the term.
- Course success prediction: Predicting the likelihood a student will pass a specific course before they register, using prerequisite performance.
- Enrollment yield modeling: Predicting which accepted applicants are most likely to enroll, allowing targeted follow-up rather than generic outreach.
- Financial aid and default risk: Modeling which students are at risk of hardship severe enough to interrupt enrollment, allowing proactive outreach.
- Advising workload triage: Predictive flags help prioritize which students need attention soonest, rather than a fixed meeting schedule.
- Course demand forecasting: Historical enrollment patterns predict which sections will fill, informing scheduling decisions before a term begins.
Real World Predictive Analytics Examples in Higher Ed
Georgia State University is one of the most documented examples of predictive analytics in higher education. Since launching its GPS Advising system in 2012, the university has tracked more than 800 individual risk indicators across its undergraduate population, generating alerts that prompt advisors to reach out within days rather than waiting for a student to fall further behind.
According to Georgia State’s own published results, the university has increased its six-year graduation rate by 23 percentage points since 2003 and now generates more than 50,000 face-to-face advisor visits a year through its early warning system, with the program credited for eliminating achievement gaps based on race, ethnicity, or income.
What made the model work was a decade of historical academic data feeding the model, hundreds of trained advisors following up on flagged alerts, and leadership treating predictions as a starting point for conversation. Several other universities, including Morgan State University, have since adopted similar advising models after studying Georgia State’s approach.
What Are the Limitations of Predictive Analytics in Higher Education?
Algorithmic bias
Predictive models trained on historical data can encode the same disparities that existed in that data. If past cohorts of certain demographic groups were under-supported and underperformed as a result, a model trained on that history can underpredict success for students from those same groups today, even without race being an explicit input.
According to New America’s research on predictive analytics in higher education, institutions should regularly audit models for disparate impact across demographic groups rather than assuming a model is neutral simply because it excludes protected characteristics as inputs.
Data quality and completeness
A model is only as reliable as the data feeding it. Missing attendance records, inconsistent gradebook entries, or delayed data syncing between systems all degrade prediction accuracy, sometimes without anyone realizing the output has become unreliable.
Explainability and the black box problem
Some of the most statistically accurate predictive models are also the hardest to explain in plain language. An advisor cannot act confidently on a risk score they cannot interpret, and a student is unlikely to trust an intervention based on a score nobody can explain to them.
Privacy and consent concerns
Predictive models rely on continuous collection of academic, behavioral, and sometimes financial data. Students are not always clearly informed about what data is being collected or how it factors into decisions that affect them. Any system handling this kind of student data needs to align with FERPA, and the U.S. Department of Education’s Student Privacy Policy Office provides guidance on what that alignment should look like in practice.
Risk of stigmatization
A student flagged as high risk can internalize that label in ways that affect their confidence and behavior, sometimes independent of whether the flag reflects their actual trajectory. How an institution communicates a risk flag matters as much as the accuracy of the flag itself.
Generalizability across institutions
A model trained on one university’s student population often does not transfer cleanly to a different institution. Vendors selling a single predictive model across many campuses should be able to explain how the model accounts for this, rather than presenting one-size-fits-all accuracy claims.
How Data Analytics in Education Turns Predictions Into Action
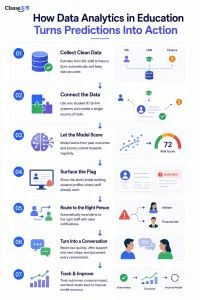
Step 1: Collect clean data from every source
Start by pulling records from your SIS, LMS, and finance systems together. Set up automatic syncing so data updates the moment something changes. Assign one team to own weekly data quality checks. Fix missing fields and duplicate entries before they reach the model.
Step 2: Connect the data in one place
Pick one student ID that every system uses to match records. Connect your SIS, LMS, and finance tools through APIs or integrations. A unified student information system can link these records automatically. Test the connection by checking one student’s full profile end to end.
Step 3: Let the model score each student
Feed years of student outcomes into your chosen predictive model. Let the model learn which patterns led to past dropouts or failures. Run the model against your current student population each week. Review the resulting risk scores before sharing them with anyone.
Step 4: Surface the flag where staff already work
Build the risk flag directly into each student’s existing profile page. Skip separate dashboards that staff have to remember to check. Use color-coded alerts so advisors spot risk at a glance. Classe365’s reporting and analytics tools show these patterns right inside the student record.
[VIDEO EMBED PLACEHOLDER: “Introducing Classe365: Complete Product Tour”, Introducing Classe365: Complete Product Tour]
Step 5: Route the flag to the right person
Set rules that route each flag to the right staff member. Send academic flags to advisors and financial flags to aid officers. Use automatic notifications so nobody has to check each day manually. Make sure the alert lands within a day of the flag.
Step 6: Turn the flag into a real conversation
Reach out to the student within a few days of the flag. Ask open questions instead of leading with the risk score itself. Offer specific next steps, like tutoring, advising, or financial aid support. Document the conversation so future flags build on real context.
Step 7: Track what happened after the intervention
Check the student’s grades and attendance a few weeks later. Compare their actual outcome against what the model originally predicted. Log whether the intervention actually changed their trajectory. Feed these results back into the model to improve future accuracy.
Review the student performance metrics guide to identify the data points to track first. Getting this foundation right matters more than the model’s sophistication.
How to Get Started with Predictive Analytics at Your Institution
Institutions considering predictive analytics for the first time should work through these steps first.
- Audit your current data quality across SIS, LMS, and financial aid systems before assuming you are ready for predictive modeling.
- Identify one or two use cases; retention risk scoring is the most common starting point, where you have both the data and staff capacity to act on results.
- Confirm how any vendor or in-house model handles bias auditing and explainability, not just accuracy claims.
- Build a clear communication plan for how risk flags will be shared with students, since undisclosed monitoring creates trust problems that outweigh the benefit.
- Start with a pilot on one program or cohort rather than deploying institution-wide immediately, so you can catch data quality issues before they scale.
- Review our LMS evaluation criteria if your learning platform feeds your model, since a poorly integrated LMS is a common source of the gaps that undermine prediction accuracy.
To see how a unified SIS, LMS, and reporting platform can give your team the clean data foundation predictive analytics depends on, book a demo with Classe365, run the numbers with our ROI calculator, or read customer feedback on the Classe365 testimonials page.
FAQ
Is predictive analytics the same as artificial intelligence in higher education?
Predictive analytics specifically forecasts future outcomes using statistical models, while AI in higher education is a broader category that also includes chatbots, automated grading, and adaptive learning content. Many predictive models use machine learning, a subset of AI, but not all AI applications in education are predictive.
How much historical data does an institution need before predictive models become reliable?
Most institutions need at least two to three full academic terms of consistent, clean data before predictive models produce reliable results, though this varies by use case. Retention models generally need less historical depth than course success prediction models, which benefit from multiple years of grade history across course sequences.
Can small colleges use predictive analytics, or is it only practical for large universities?
Small colleges can use predictive analytics, though the use cases that work best often differ from large universities. A small institution may get more value from simple retention risk scoring than from enrollment yield modeling, which typically needs a larger applicant pool to produce statistically meaningful patterns.
Do students need to consent before their data is used in predictive models?
Requirements vary by institution and jurisdiction, but best practice is to disclose clearly what data is collected and how it factors into advising decisions, even where formal opt-in consent is not legally required. Institutions that skip this step risk student trust issues that can undermine the program regardless of its technical accuracy.
What happens when a predictive model flags a student incorrectly?
False positives and false negatives are inherent to any predictive model, which is why flags should prompt a human conversation rather than an automated decision. A well-designed program treats a risk score as a starting point for an advisor to investigate, not a verdict on the student’s likely outcome.
How do predictive analytics tools differ from a learning management system’s built-in analytics?
An LMS typically reports descriptive metrics, assignment completion, login frequency, and grade distribution, without forecasting future outcomes. Predictive analytics tools go a step further, using that same underlying data to estimate the probability of a future event like course failure or non-enrollment.
Can predictive analytics replace academic advisors?
No. Every well-documented successful predictive analytics program in higher education depends on human advisors acting on the flags the system generates. The technology surfaces signals faster than manual review would, but the intervention still requires a person.
How often should an institution retrain or re-audit its predictive models?
Most institutions review model performance at least once per academic year, checking whether predictions still hold up against actual outcomes and whether any demographic group is being systematically over- or under-flagged. Retraining more frequently may be warranted if the student population or data sources change significantly.